Projection Bandwidth

The Projection Bandwidth indicator is based on the Projection Bands as introduced by Mel Widner, Ph.D in an Technical Analysis of Stocks & Commodities magazine article from July, 1995.
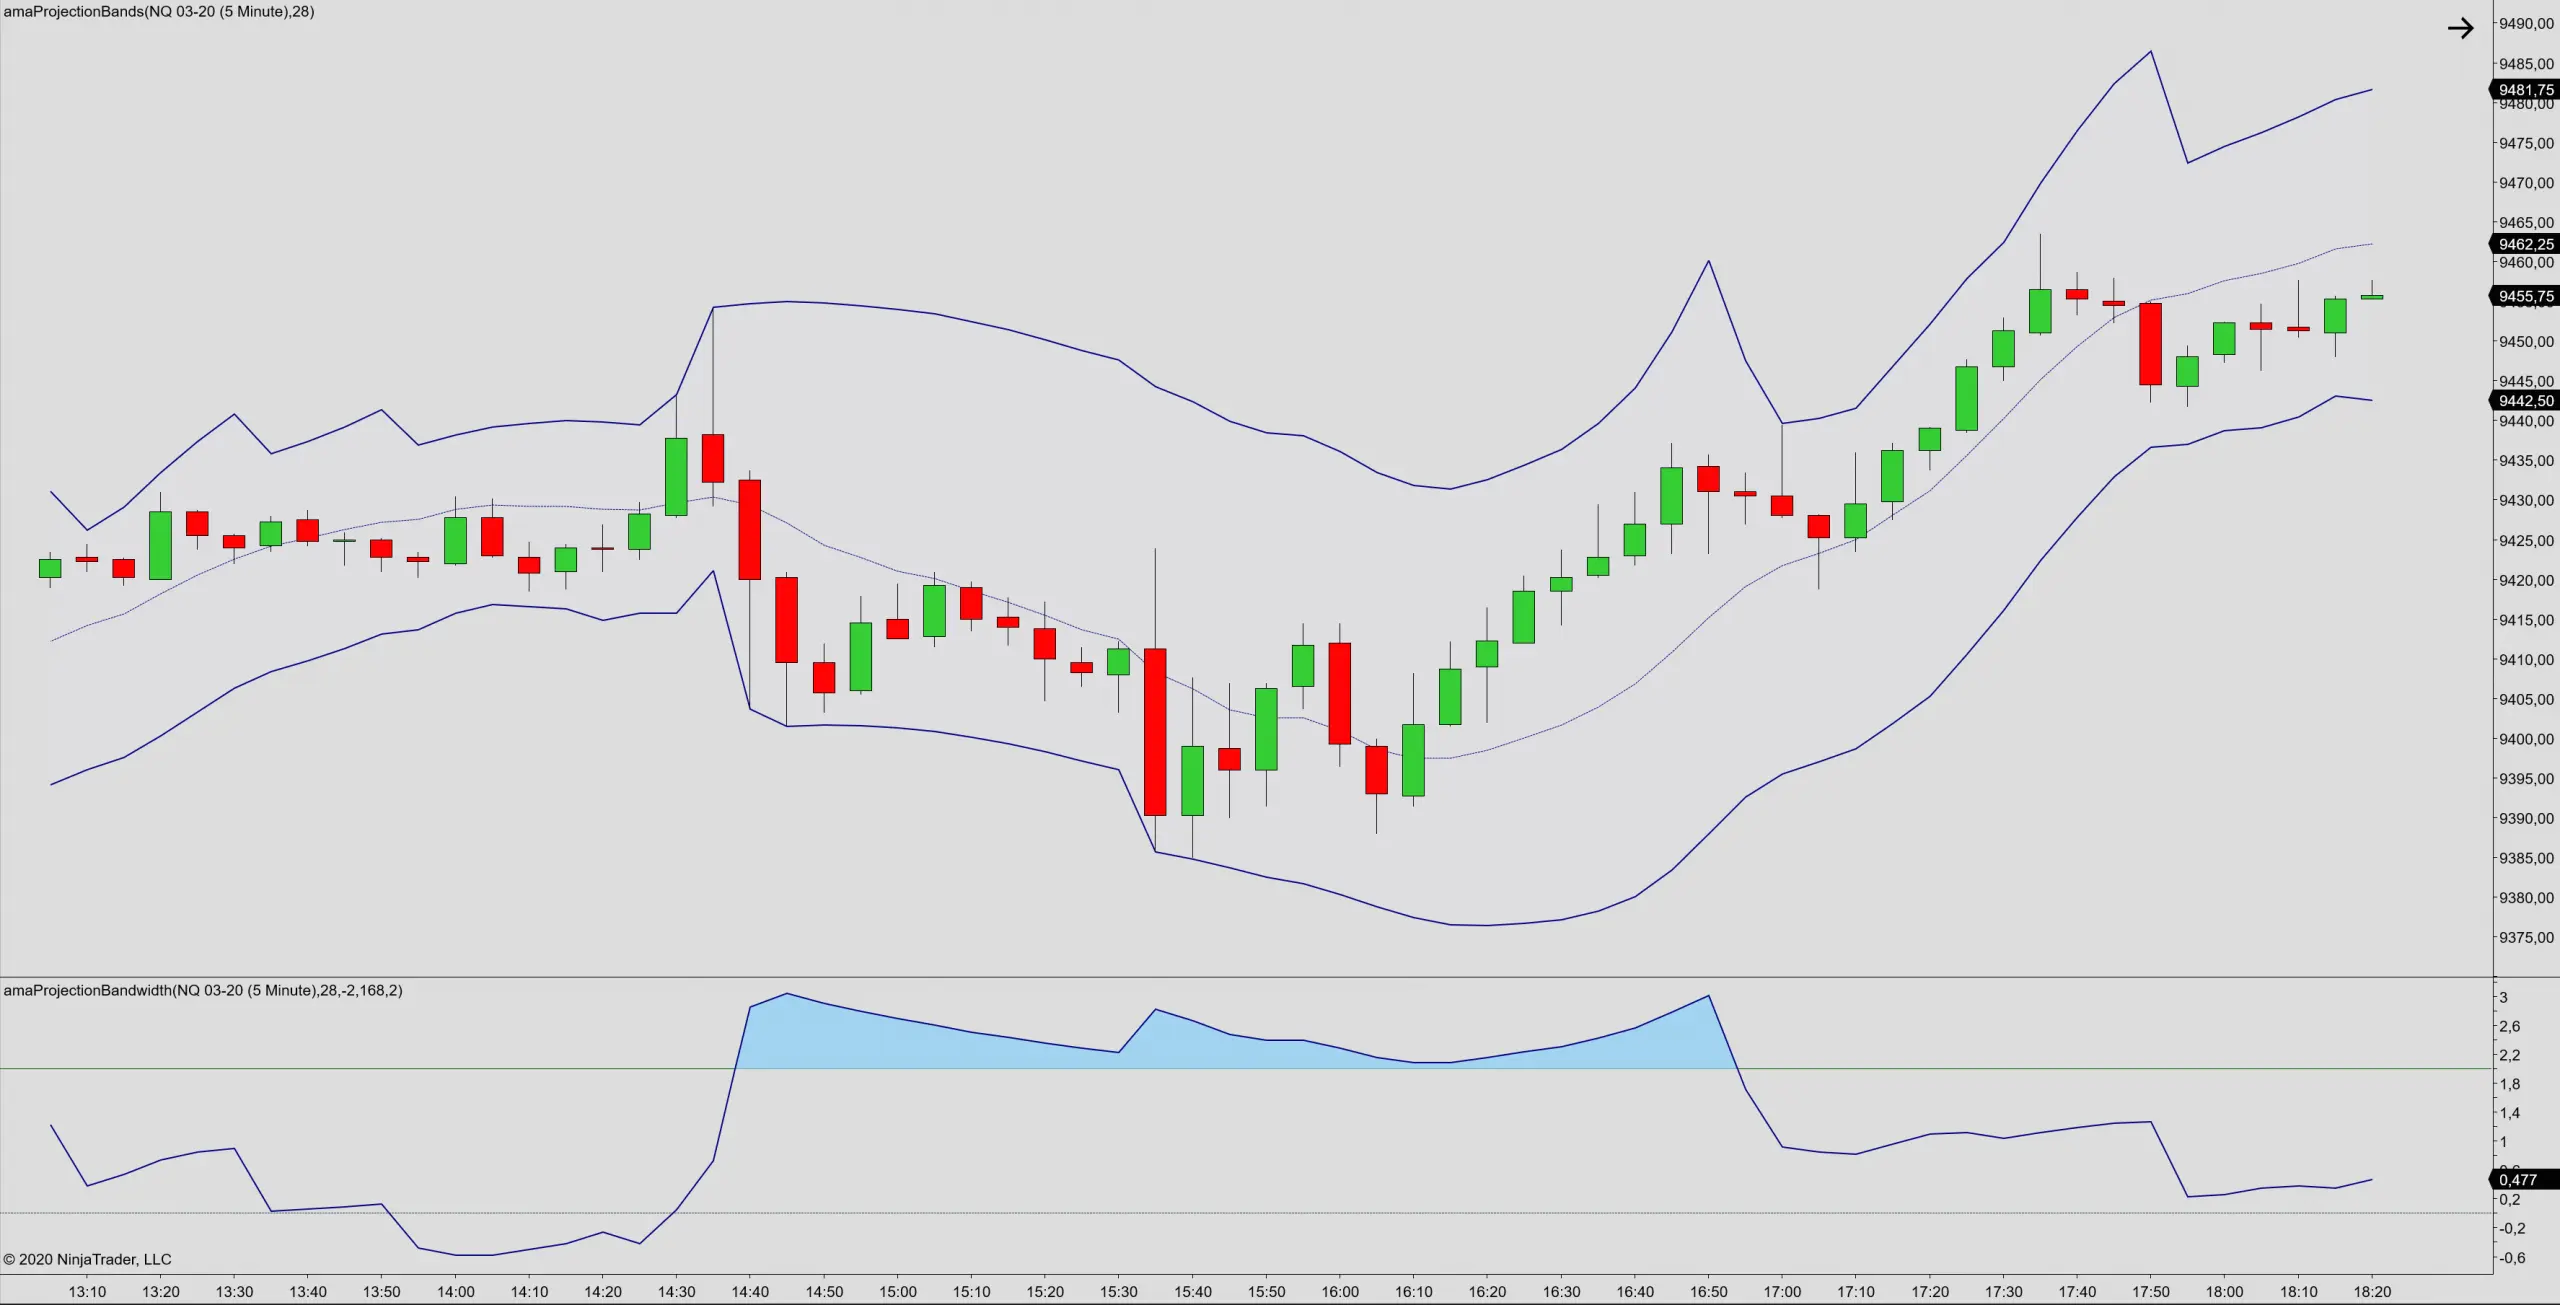
Projection Bandwidth indicator for NT8

Indicator Description

Projection Bandwidth is based on the Projection Bands and shows the ratio from bands to midpoint. Bands are narrowing on low numbers whereas high numbers indicate that the bands are widening. Therefore, you may use the bandwidth as a measure of volatility. Narrow bands equals narrow range and low volatility, whereas wide bands indicate a wide range and high volatility. The indicator furthermore comes with shaded color plots, indicating when the bandwidth is likely overbought / oversold.

Other Library indicators

One application of the indicator is to use it as a filter to validate Opening Range Breakouts. You may also want to review market structure and trend bias from a higher timeframe using the Swing Trend indicator.

Other entries from the Channel Indicators categories include the Fibonacci Bands, Multiple Deviation Bands, Residual Standard Deviation Bands and the Multiple Bollinger Bands. You may also want to review the Volatility Indicators category, specifically the Daily Range Projections, Weekly Range Projections and the Monthly Range Projections. Our Indicator Spotlight discussed the Daily Range Projections and you may also have a look at the Spotlights on the Regression Channel, Donchian Channel, TDI Indicator, the Current Week VWAP and the daily Pivot Point Indicator. Finally, you may want to review our discussion of the Fibonacci Retracement Levels (with video).

The Projection Bandwidth indicator is available for NinjaTrader 8.

Projection Bandwidth

Disclaimer

Futures, stocks, and spot currency trading contains substantial risk and is not for every investor. An investor could potentially lose all or more than the initial investment. Risk capital is money that can be lost without jeopardizing ones financial security or lifestyle. Only risk capital should be used for trading and only those with sufficient risk capital should consider trading. Past performance is not necessarily indicative of future results.

CFTC RULE 4.41 – HYPOTHETICAL OR SIMULATED PERFORMANCE RESULTS HAVE CERTAIN LIMITATIONS. UNLIKE AN ACTUAL PERFORMANCE RECORD, SIMULATED RESULTS DO NOT REPRESENT ACTUAL TRADING. ALSO, SINCE THE TRADES HAVE NOT BEEN EXECUTED, THE RESULTS MAY HAVE UNDER-OR-OVER COMPENSATED FOR THE IMPACT, IF ANY, OF CERTAIN MARKET FACTORS, SUCH AS LACK OF LIQUIDITY. SIMULATED TRADING PROGRAMS IN GENERAL ARE ALSO SUBJECT TO THE FACT THAT THEY ARE DESIGNED WITH THE BENEFIT OF HINDSIGHT. NO REPRESENTATION IS BEING MADE THAT ANY ACCOUNT WILL OR IS LIKELY TO ACHIEVE PROFIT OR LOSSES SIMILAR TO THOSE SHOWN.


This website is intended for educational and informational purposes only and should not be viewed as a solicitation or recommendation of any product, service or trading strategy. No offer or solicitation to buy or sell securities, securities derivative or futures products of any kind, or any type of trading or investment advice, recommendation or strategy, is made, given, or in any manner endorsed by LizardIndicators and the information made available on this website is not an offer or solicitation of any kind.

<< Categories