The Multiple Deviation Bands are a generalized version of the Bollinger Bands. While the Bollinger Bands are built from a SMA with standard deviation bands, this indicator allows for selecting one of over 30 different moving averages as the midband and comes with 3 different algorithms to calculate the bands.
Indicator Description
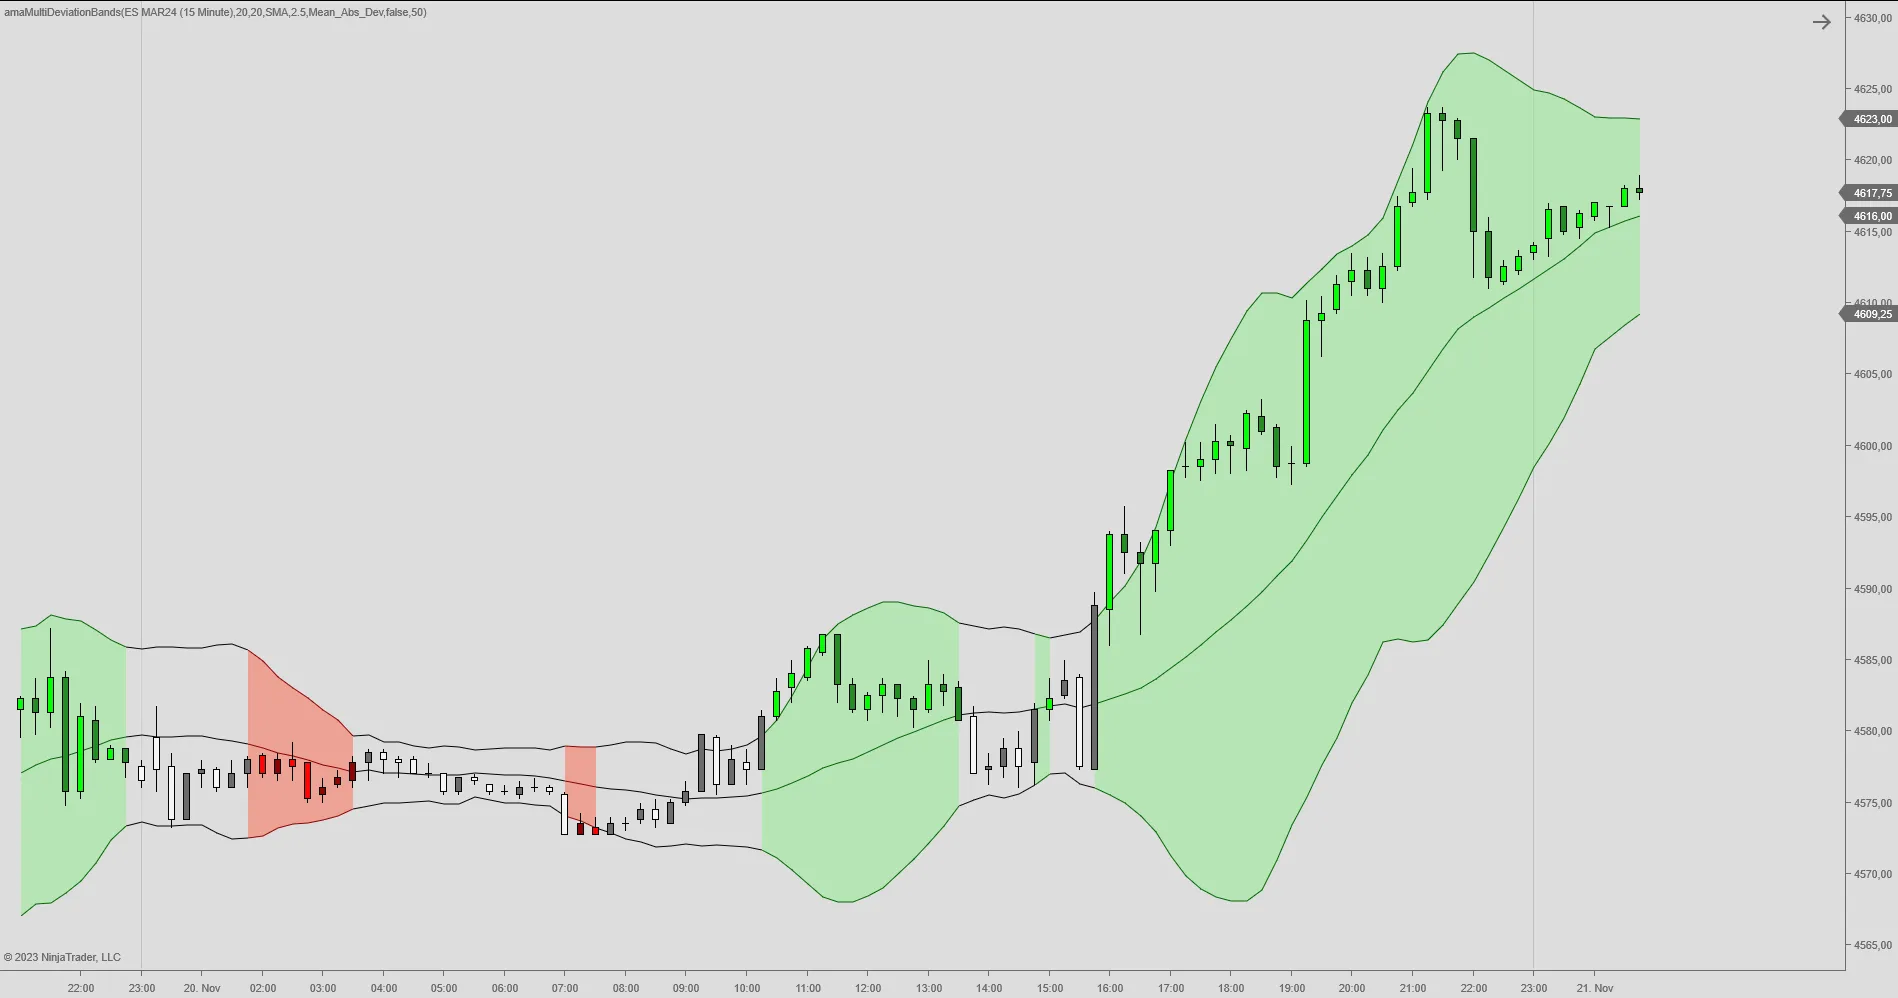
The Multiple Deviation Bands indicator consists of a midband and an envelope. You may select one of over 30 different moving averages as the midband. Midband and envelope are colored according to the slope of the midband, which can be upsloping, neutral or downsloping. There is a parameter to adjust the flatness which is considered as neutral. All slope calculations are volatility adjusted. The sign of the slope is exposed as public property and can be used as a trend indication. The trend can also be shown via paintbars.
Three different formulas may be used for calculating the deviation bands. The default setting uses the mean absolute deviation (MAD) from the selected moving average. Alternatively, the median absolute deviation (MAD) or the root mean square deviation (RMSD) can be used. The upper band is obtained by adding a multiple of the deviation to the midband, while the lower band is obtained by subtracting a multiple of the deviation from the midband. Unlike for classical Bollinger Bands you may use different lookback periods for calculating the midband and the deviation.
The Multiple Deviation Bands can be used in a similar way as the classical Bollinger Bands. In particular, to detect a “Bollinger Squeeze” in a range bound market to signal breakout setups after a “squeeze”.
Other Library indicators
Other library indicators that utilize deviation bands for determining trading setups include the Fibonacci Bands, Projection Bands, Projection Bandwidth Residual Deviation Bands and our Squeeze Indicators. The Current Day Median and the Daily, Weekly, Monthly and N Monthly VWAPs also fall into this category but are located under session tools.
The Squeeze and VWAP trading setups were furthermore discussed in our Indicator Spotlight. You may also want to review the Volatility Indicators category, specifically the Daily Range Projections, Weekly Range Projections and the Monthly Range Projections. The Indicator Spotlight also discussed the Daily Range Projections. Finally, you may have a look at our posts on the Ichimoku Cloud, the TDI Indicator and the daily Pivot Point Indicator.
Finally, our Indicator Spotlight has also reviewed other indicators from our Channel Indicators category, namely the Squeeze Channel, Regression Channel and the Donchian Channel.
The indicator is available for NinjaTrader 8.