The Monthly Range Projections indicator displays support and resistance levels based on the volatility of the prior N months. The noise bands show how far noise trader typically drive prices. A breakout from these levels will indicate participation from higher timeframe traders, bringing Range Projections, i.e. profit target bands, into play. Apart from the version found here in the Library section, you may also review the features of the Premium Range Projections Suite and register for FREE trial anytime.
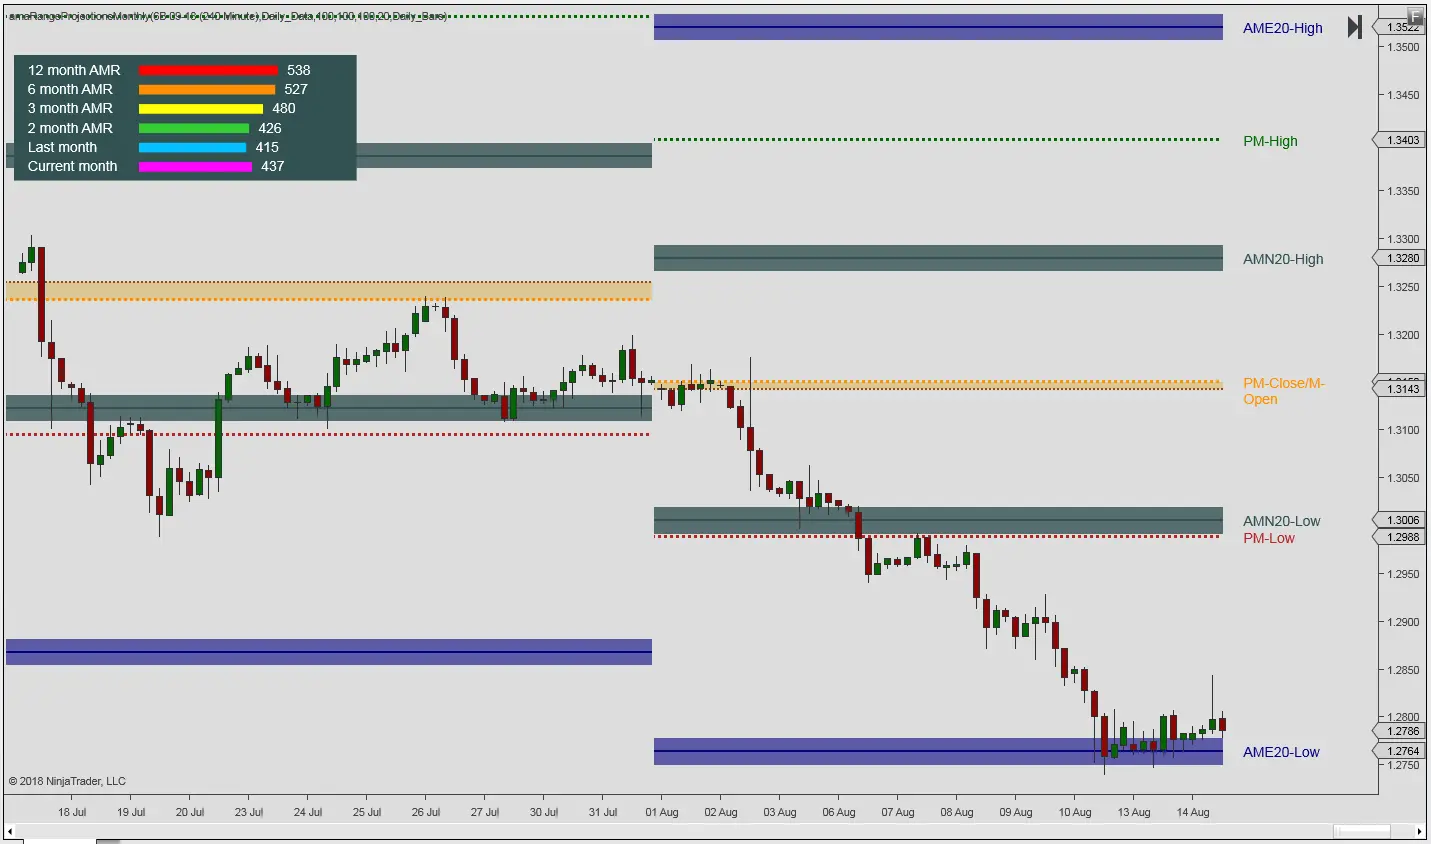
Indicator Description
The Monthly Range Projections detects the average monthly noise (AMN). The AMN is defined as the smaller of (High – Open) and (Open – Low). The upper band is located by adding the expected noise to the current open. Conversely, the lower band is located by subtracting the expected noise from the current open.
The Range Projections are targets that come into play once the price has broken outside the noise bands. There are two ways of determining the targets:
- The average monthly range over N months added to the current low (high projection) or subtracted from the current high (low projection).
- Monthly expansion from the open Max(High – Open, Open – Low) averaged over N months and added to and subtracted from the open.
The indicator will also display the gap from the prior months close.
How to read Monthly Range Projections
Our Range Projections indicators are built on the same logic as other library session indicators. The Open, High, Low and Close levels can therefore be located by using either daily- or intraday data. Of course, monthly data reflects the contractual settings of the instruments, accounting for extended sessions that occur with public holidays. Therefore, the daily data option is the default setting.
Contrary to common knowledge, markets are in ranging mode some 80% of the time. It is therefore generally a good idea to watch how the market interacts with the average monthly noise levels. For example, you may want to look for price rejection, at the first test of the AMN high / low. Conversely, if we break beyond the average monthly noise, it points to institutional participation. In this scenario we should be looking for momentum entries.
Other Library Indicators
You may want to combine the Range Projection indicators with one of our standard momentum oscillators. The category features a number of other entries, such as the Acceleration Deceleration and the standard Stochastics. We also have a category for advanced oscillators, with among others the Projection Oscillator and the SVE Stochastics ITF. These tools build on the same concept as the standard momentum oscillators, but with a higher degree of sophistication. In general, they allow for added value approaches, utilizing a set of more complex algorithms.
The Monthly Range Projections is available for NinjaTrader 8. The indicator library also features the Range Projections Weekly and and our Indicator Spotlight looked at how to trader the Average Daily Range (with video). Finally, a separate Range Analysis indicator can also be used to determine a higher timeframe consolidation / contraction period, as discussed in our Indicator Spotlight on the Opening Range Breakout Strategy. A complete list of our NinjaTrader Indicators available here.