The Range Projections Suite indicators display support & resistance and expansion bands based on the average range of the prior N sessions. Noise Bands show how far retail traders typically drive prices and represent areas of support & resistance. Once these levels are breached, it typically indicates participation from higher timeframe traders. At that point, Range Expansion Bands or Range Projection Bands may be used to place targets. Compare the premium features with the library version here and register for FREE trial anytime.
Indicator Description
Daily Projections:
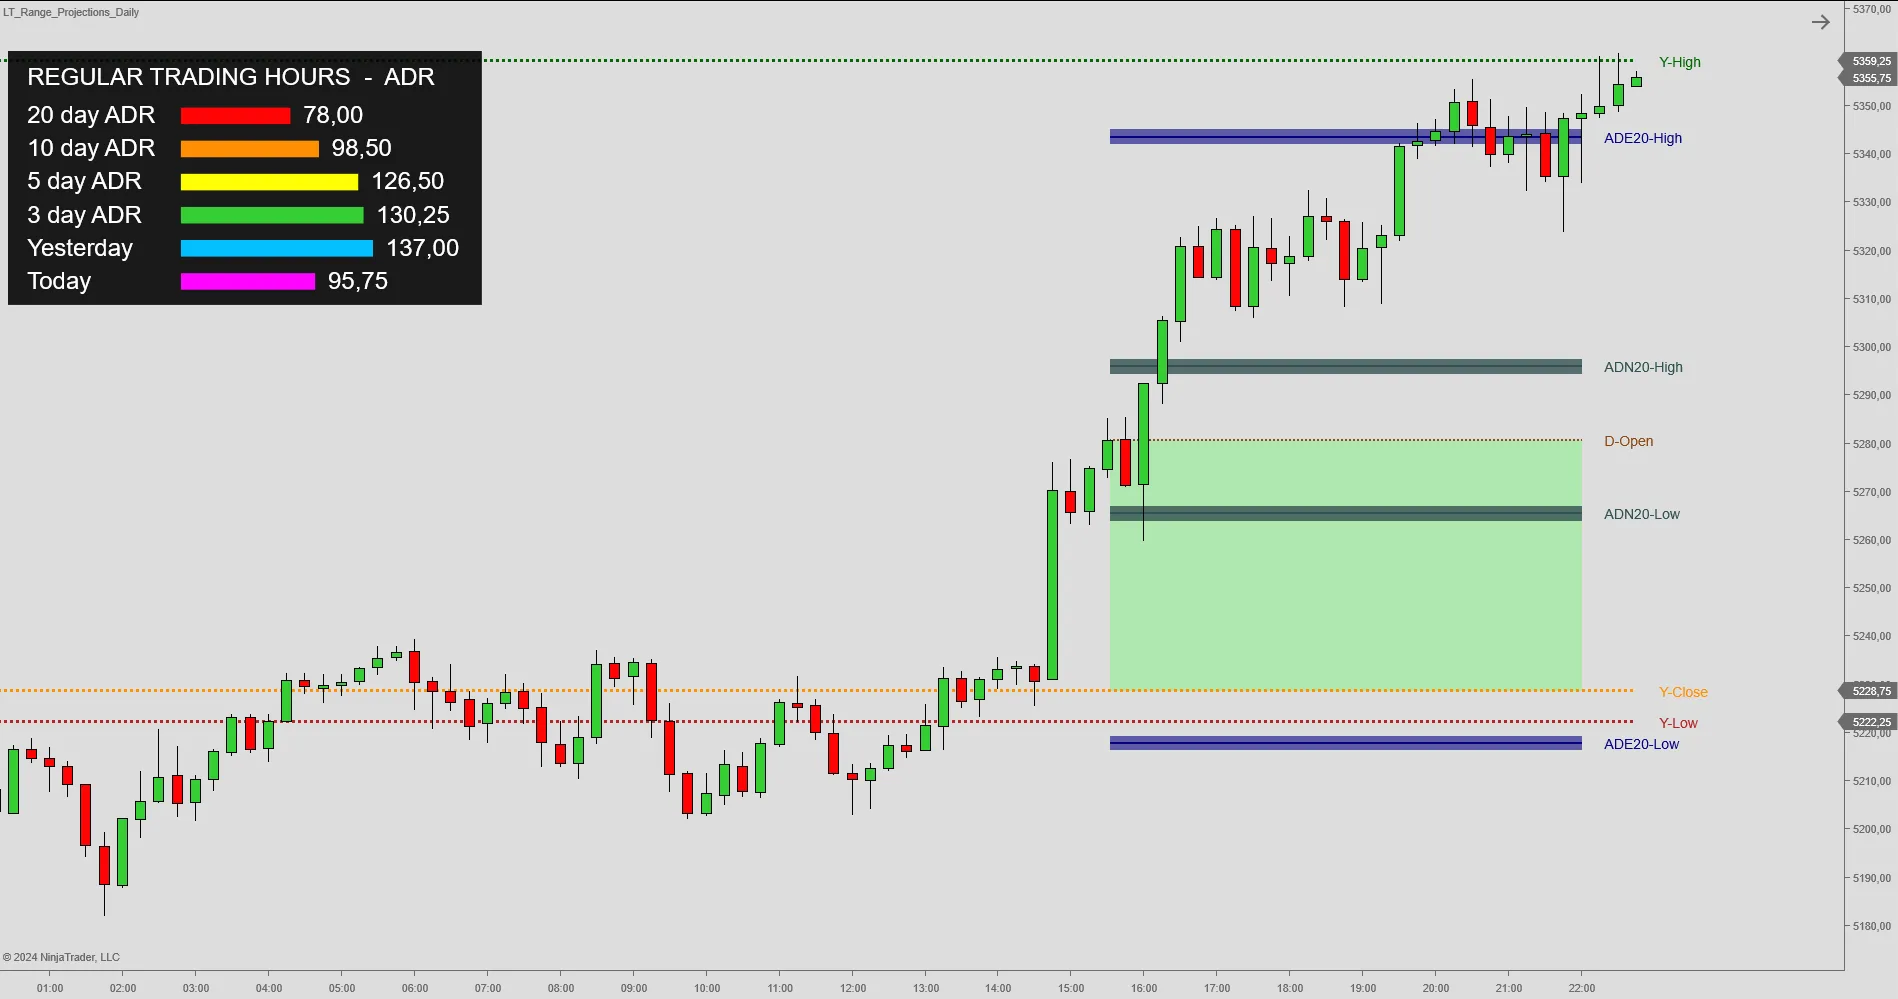
Expected noise levels are found by looking at the previous N days and averaging the differences between the open and the closest extreme from the open on each day. The upper Noise Band is then determined by adding the expected noise to the current open. Conversely, the lower Noise Band is located by subtracting the expected noise from the current open. Once prices break outside the Noise Bands, the indicator offers two ways of determining potential targets:
- Expansion Bands: Expansion levels are found by looking at the previous N sessions and averaging the differences between the open and the farthest extreme from the open on each day. To calculate the Expansion Bands the expected expansion is then added to and subtracted from the open.
- Range Projection Bands: Adding the average daily range over N sessions to the current low for the high projection. Subtracting the average daily range over N sessions from the current high for the low projection.
All bands may also be calculated for partial sessions of the trading day, such as the regular session, the Asian session, the European session or the US session.
Weekly and Monthly Projections:
Weekly or monthly projections are calculated by looking at the previous N weeks or N months. Noise Bands, Expansion Bands and Range Projections Bands are calculated in a similar fashion from weekly and monthly input parameters.
Weekly and monthly projections may also be calculated for partial sessions of the trading day.
Premium Features:
All levels print within seconds after the opening price. This is a major advantage over the classical opening range indicators which only show the opening range when the opening period is complete. Noise Bands and Expansion Bands do not change throughout the session. Range Projection Bands are adjusted every time a new high or a new low has been made. Once price has reached the Range Projection Bands they are frozen at a distance of the average range.
The user may also select a percentage for each of Noise Bands, Expansion Bands and Range Projection Bands to display them at a smaller or larger distance from the open, low or high.
All expected levels may also be calculated by replacing the average calculation with a median calculation. In this case median noise, median expansion and median range are used for calculating the projection bands. The median calculation is generally considered more robust and will not be skewed by outliers.
In addition, a backend database with contractual trading hours of S&P Stocks and all major futures contracts traded on the CME, CBOT, EUREX, ICE or NYMEX has been added. A second database tracks the CME holiday schedule. Specifically, holiday sessions are excluded from calculating projections, seeing that they are not representative for the typical trading range.
| Indicator Price | $ 275.00 | ||