The Ichimoku Kinko Hyo, also known as the Ichimoku Cloud, is a versatile indicator that defines support / resistance, trend direction, momentum and trade signals. The indicator was developed by Goichi Hosoda and you may compare the Premium features with the library version here. You may register for FREE trial anytime.
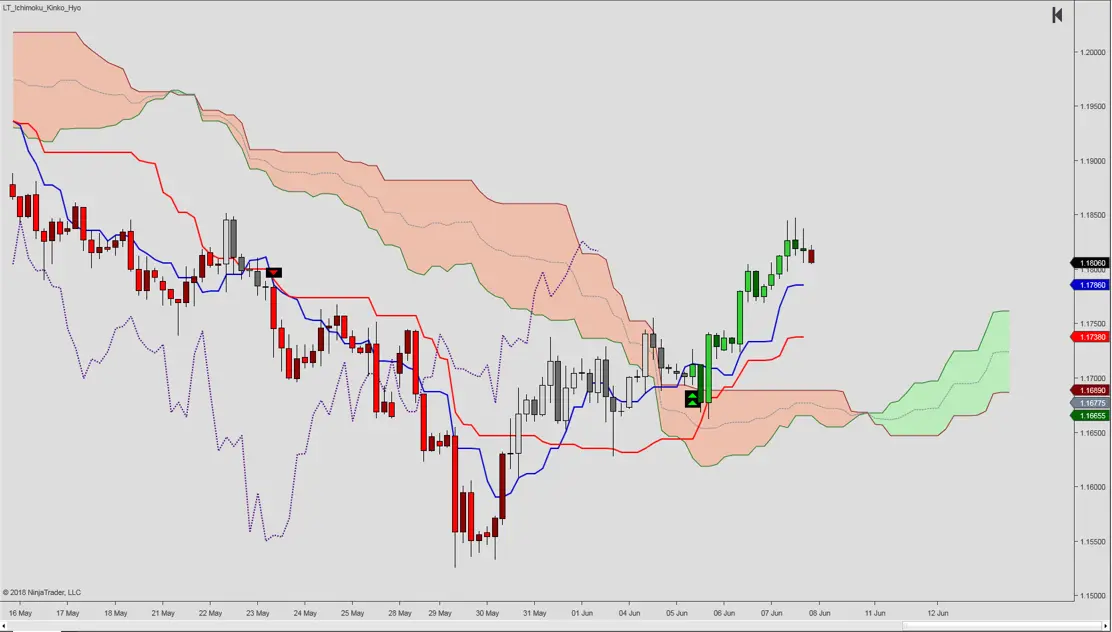
Indicator Description
A quick intro to our NinjaTrader Ichimoku Kinko Hyo is available from our Indicator Spotlight, discussing the general concept behind Ichimoku trading.
The Cloud:
The most characteristic feature of the Ichimoku Kinko Hyo indicator is the cloud (Kumo). It is comprised of two lines, the Senkou Span A (green) and the Senkou Span B (red). Therefore, trends are identified by determining whether prices are trading above or below the the cloud. If prices are trading within the cloud, it indicates a sideways market.
Moreover, uptrends are considered strong when the Senkou Span A (green line) cross above the Senkou Span B (red line), plotting a green cloud. Strong downtrends have a falling Senkou Span A (green line), crossing below the Senkou Span B (red line), plotting a red cloud. In addition, the cloud is displaced 26 bars forwards and can also provide a forecast for future support / resistance.
Tenkan-sen vs. Kijun-sen:
First, the Tenkan-sen (blue) vs. Kijun-sen (red) lines will identify faster and more frequent market moves. The Tenkan-sen is calculated with a 9-period high, adding a 9-period low and dividing by two (9-period high + 9-period low)/2)). The Kijun-sen applies the same formula on a 26 period (26-period high + 26-period low)/2)).
The relationship between the two is similar to that of a 9 and 26 period moving average. Consequently, the 9-period is faster and follows the price plot relatively closely, whereas the 26-period is slower. Similarly, 9 and 26 periods are also used to calculate MACD.
Ichimoku Kinko Hyo Setups:
The classic signal is to wait for the Tenkan-sen to cross the Kijun-sen. However, although effective, the signal will occur infrequently in strong trends. Therefore, additional signals may be located when price crosses the Tenkan-sen, alternatively the Kijun-sen.
The most favorable setups will align with the cloud and the major trend (above green cloud = bullish / below red cloud = bearish). The cloud can also be as support for retracement entries in an uptrend. Conversely, one may use the cloud as resistance for retracement entries in a downtrend.
Finally, the Chikou Span is the close displaced 26 bars back and show the current momentum.
The premium version identifies eight (8) different conditions:
- Price vs. Tenkan (Tenkan Cross): up, down
- Price vs. Kijun (Kijun Cross): up, down
- Tenkan vs. Kijun (Tenkan Kijun Cross): up, down, neutral
- Price vs. Kumo: up, down
- Price vs. Kumo midline: up, down
One may view the above plots from the current price action, whereas the below are projected 26 bars forward or backwards:
26 bars forward:
- Senkou A vs. Senkou B (Senkou Cross) up, down, neutral
26 bars backwards:
- Chikou vs. price (Momentum(26)): up, down
- Chikou vs. Kumo (Long Term Momentum): up, down, neutral
Ichimoku Kinko Hyo Paintbars:
Based on these conditions, you may display a composite trend via paintbars. To clarify, a bullish/bearish trend will see at least one bullish/bearish condition while allowing neutral states from other conditions. A composite trend reading with contradictory readings, i.e. both bullish and bearish conditions will display as neutral.
In addition, the indicator also offers:
- Trade signals based on on the composite trend
- Key signals
- Alerts (log and sound)
- Market Analyzer signal and trend scanner
Please review our posts on Ichimoku Trading and the London Breakout Trade for additional information.
The premium and Library Ichimoku indicator is available for NinjaTrader 7 and 8.
| Indicator Price | $ 225.00 | ||