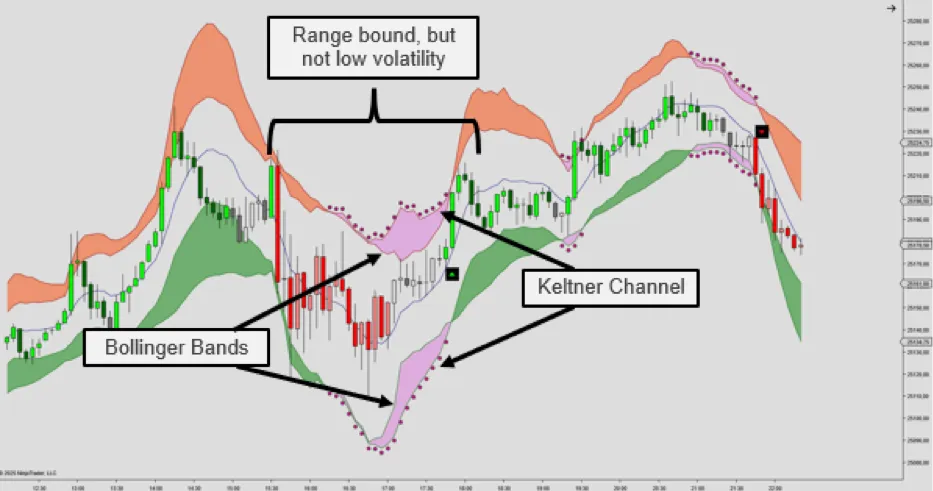
A frequently discussed volatility setup is the TTM Squeeze, which occurs during periods of low volatility and price consolidation. In this Indicator Spotlight, we’ll revisit the concept as described by John F. Carter’s in Mastering the Trade. We’ll explain how it differs from the classic Bollinger on Bollinger Bands® approach, and then show how the LizardIndicators Library version combines both concepts into a more flexible framework.
To learn more, watch the video or continue reading below:
Understanding the Squeeze Setup
Periods of low volatility are often followed by strong directional moves. The TTM Squeeze setup aims to identify these contraction phases before volatility expands again. Specifically, traders use this setup to identify scenarios when the market is building up momentum for its next major move higher or lower. There are a few ways to define a Squeeze:
The Bollinger Squeeze
The Bollinger Squeeze identifies low volatility by measuring when the Bollinger Bandwidth, i.e., the standard deviation around a moving average, reaches a minimum within the lookback period (default: 120 bars). When this occurs, the market is said to be “in a squeeze.” Bollinger suggests confirming breakout direction with momentum or volume-based indicators, such as the RSI.

Carter’s TTM Squeeze / Bollinger-Keltner Squeeze
In contrast, John Carter’s version compares the Bollinger Bands with the Keltner Channel. This is what’s known as a “Trade The Markets Squeeze” (TTM). It occurs when the Bollinger Bands contract to a point where they move inside the Keltner Channel. We then have a consolidation squeeze, as true range volatility is compared to the directional volatility. Breakouts occur when the Bollinger Bands expand back outside the Keltner Channel, typically confirmed by a 13-bar momentum filter.
Carter’s approach is therefore not purely about low volatility, but about identifying sideways market conditions where directional potential is building.

Full and Hybrid Squeeze Variants
The LizardIndicators Library version of the TTM Squeeze includes two additional definitions that build on these concepts:
Full Squeeze: Combines both the Bollinger and TTM Squeeze conditions. This identifies scenarios where volatility is low and price action is consolidating.

Hybrid Squeeze: A broader definition that includes all Bollinger and Bollinger/Keltner squeezes.
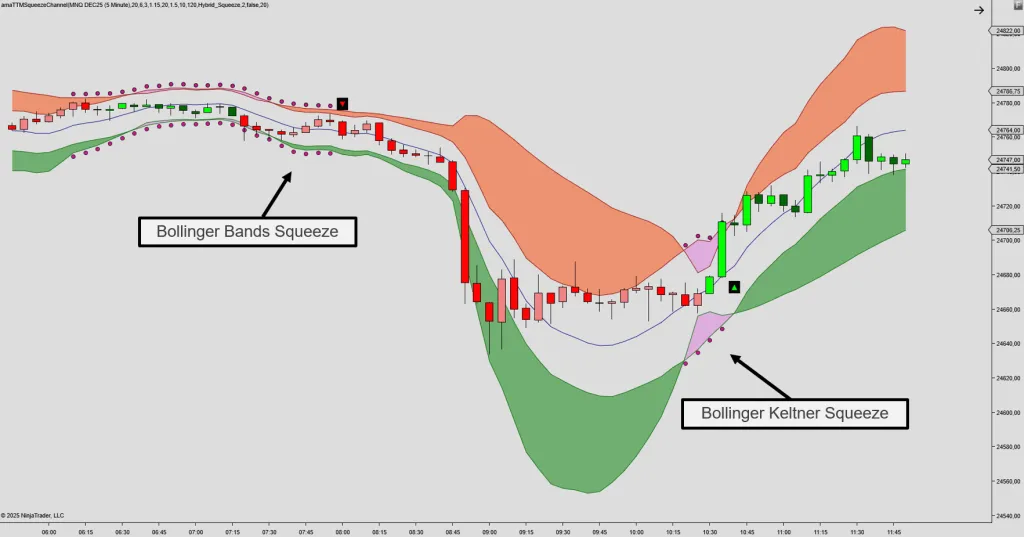
In addition, for the Bollinger Bands Squeeze, we’ve added a volatility threshold. Increasing this value makes the setup more selective, further restricting the low volatility definition.
Confirming the Breakout
While volatility contraction highlights potential setups, we’ve found that price action confirmation may improve the TTM Squeeze signals. For this, we apply a Thrust Bar condition:
- Long breakout: The close is above the prior high.
- Short breakout: The close is below the prior low.
This ensures that entries are based on confirmed breakouts rather than “anticipated opportunities” (although with a slightly delayed entry)
Additional parameters include:
- Minimum Squeeze Bars: Required number of consecutive squeeze bars (default: 3).
- Maximum Trigger Bars: Number of bars allowed for a valid signal after the squeeze ends (default: 5).
Visualizing the TTM Squeeze
To better illustrate the setup, we’ve introduced the TTM Squeeze Indicator, which presents the trend and momentum context in a cleaner format. The indicator uses color-coded squeeze dots below the chart to represent each condition:
- White dots: Bollinger Squeeze
- Cyan dots: Bollinger/Keltner Squeeze
- Yellow dots: Full Squeeze (both conditions)
Momentum and trend information are shown on a lower panel, while breakout confirmation is provided by Thrust Bars on the price chart. This offers a less cluttered display compared to the Squeeze Channel version, while retaining the essential volatility and trend information.

Session Timing and Volatility Context
Volatility is not evenly distributed throughout the trading day. For intraday traders, it can be useful to focus on time windows that historically produce stronger follow-through.
For example, during the 08:00–09:00 CET window, many European markets build anticipation ahead of the regular open. Identifying squeezes during this period often coincides with increased breakout probability once the session begins.
To visualize this, we use the Daily Range Projections, which display Noise and Expansion Bands based on recent price behavior.

Noise and Expansion Bands
The Noise Bands represent average price fluctuations caused by short-term or “noise” traders, calculated from recent session data. Price movement within these bands is typically random and not driven by fundamentals. When price breaks beyond the noise levels, it may indicate participation from higher-timeframe traders.
The Expansion Bands extend this analysis by showing how far, on average, price has traveled from the open over the past 20 sessions. Together, the Noise and Expansion Bands help distinguish between insignificant range activity and meaningful breakouts.

Summary
The TTM Squeeze Indicator expands upon the classic Bollinger and Keltner-based approaches. With the addition of the Full and Expansion configurations, Thrust Bar confirmation, and session-based filters, traders can better isolate high-quality breakout conditions.
Used together with the Noise and Expansion Bands, the indicator offers both a structural and statistical framework for identifying meaningful volatility shifts.
Where to Find It
The TTM Channel Squeeze can be found in the Volatility Indicators category of our Indicator Library, alongside:
- The Squeeze Channel
- The Squeeze, featuring additional histogram options for trend and volatility assessment
- The TTM Squeeze, displaying Carters application of the momentum calculation
The LizardIndicators Squeeze & Squeeze Channel versions apply the balanced momentum calculation, addressing the common drop-out effect seen in many standard indicators.
The Indicator Library includes over 145 tools available for a one-time payment of $195, covering all indicators in the suite — no subscriptions, no recurring fees.
Premium Range Projection Tools
The concepts shown here can be extended beyond the daily timeframe. Our Premium Range Projection Indicators include weekly and monthly projections, offering insight into broader market cycles and key turning points. Register for a free trial of the Range Projections Suite here.