The amaTTMSqueeze builds on the framework of our original amaSqueeze indicator and reflects the concepts introduced by John Bollinger (Bollinger on Bollinger Bands®) and John F. Carter (Mastering the Trade).
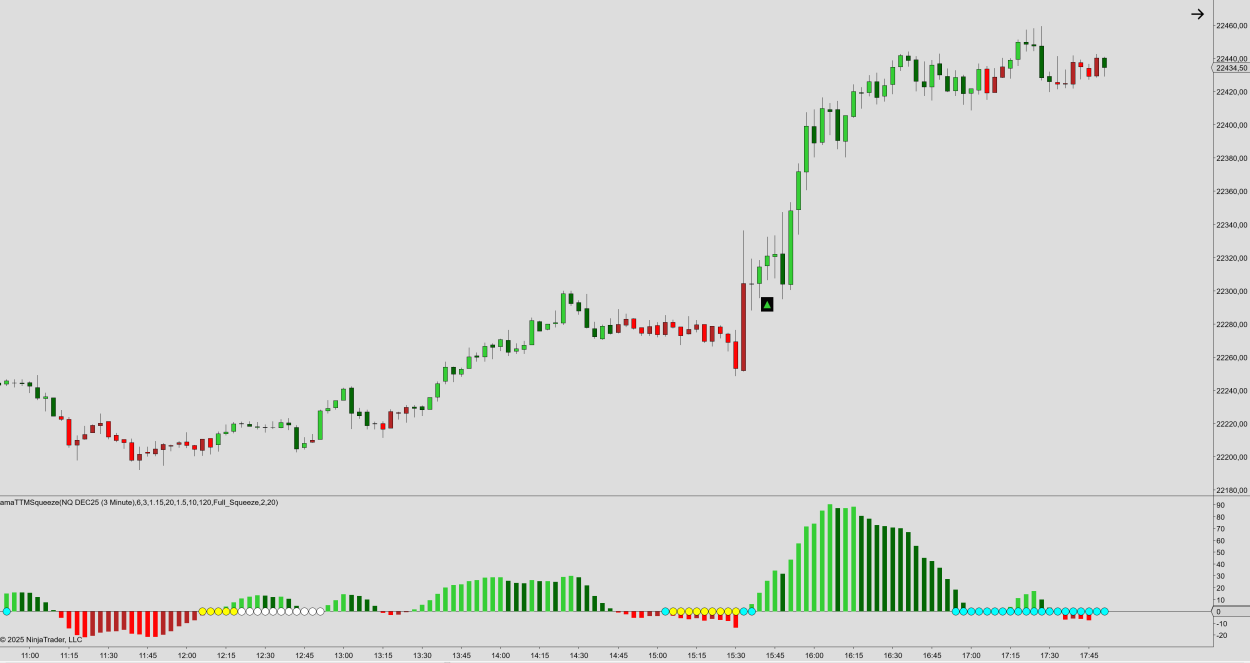
Indicator Description
The TTM Squeeze
The TTM Squeeze stands for Trade the Markets Squeeze and was introduced by John F. Carter (Mastering the Trade). The setup identifies periods of contraction or low volatility, conditions that often precede significant directional moves.
The TTM Squeeze occurs when the Bollinger Bands® narrow and move inside the Keltner Channel, signaling a period of consolidation. A potential breakout is indicated once the Bollinger Bands® expand and move back outside the Keltner Channel. Unlike the pure Bollinger setup, this version does not necessarily reflect a low volatility minimum but rather a shift between contraction and expansion. The TTM Squeeze applies the Average True Range (ATR) in the Keltner Channel calculation, providing a more accurate representation of true range volatility.
Within our version of the TTM Squeeze, four variations of the squeeze can be applied:
- Keltner-Bollinger Squeeze (default)
- Bollinger Squeeze
- Full Squeeze (both Bollinger AND Keltner-Bollinger conditions met simultaneously)
- Hybrid Squeeze (either Bollinger OR Keltner-Bollinger Squeeze)
Momentum Calculation
The momentum is calculated using the closing price relative to the Donchian midline, combined with a Simple Moving Average (SMA) and smoothed using Linear Regression. Two parameters allow for fine-tuning of the momentum output:
- Momentum Period: Defines the lookback length used to calculate momentum
- Regression Period: Controls the level of smoothing applied to the momentum histogram
This approach provides an alternative to the dual fast/slow momentum system of the original LizardIndicators Squeeze indicator, providing a more fluid histogram and clearer trend visualization.
Trade Signals
Trade setups are confirmed through price action validation, using a Thrust Bar condition:
- Long Setup: Signal bar must close above the high of the previous bar (Up Thrust Bar).
- Short Setup: Signal bar must close below the low of the previous bar (Down Thrust Bar).
This confirmation may lead to slightly later entries, but typically results in higher-probability signals. Additional filter parameters include:
- Minimum Squeeze Bars: Required number of consecutive squeeze bars (default: 3).
- Maximum Trigger Bars: Maximum bars allowed for a valid signal to trigger after the squeeze ends (default: 5).
Market Analyzer Columns
The TTM Squeeze integrates with the Market Analyzer, providing quick access to key signal information:
- Squeeze: On (+1) / Off (0)
- Momentum Trend: Long (+1), Short (-1), or Neutral (0)
- Trade Signals: Long Signal (+1), Short Signal (-1), or No Signal (0)
Other Library Indicators
The library has a separate version of this indicator displaying the Squeeze momentum setup via channel lines.
You may increase the probability of locating profitable setups from the Squeeze momentum indicator by determining the higher time frame trend bias, analyzing range / volume and avoid entries that run into key support / resistance levels. A variety of Support / Resistance indicators are available from the Session Tools and Fibonacci indicators categories, including the Current Day Fibonacci Levels / Prior Day Fibonacci Levels, Current Week Fibonacci Levels / Prior Week Fibonacci Levels, the Current Month Fibonacci Levels / Prior Month Fibonacci Levels and the Current N Month Fibonacci Levels / Prior N Month Fibonacci Levels . A Indicator Spotlight looked at Fibonacci Retracement Levels specifically.
Additional support resistance levels can be found using the Average Range for a daily, weekly or monthly lookback period. This may for example be done using a ADR indicator, alternatively the Weekly Range Projections / Monthly Range Projections. The Indicator Spotlight furthermore reviewed the Average Daily Range Projections.
For volume analysis you may consider the Better Volume indicator, Force Index or Relative Volume. Our NinjaTrader Relative Volume indicator was discussed in our Indicator Spotlight. For instruments that lack reliable volume information (FX/Crypto currencies), you may consider analyzing Relative Ranges. The Relative Ranges indicator was also reviewed in the Indicator Spotlight. A separate Range Analysis indicator can also be used to determine a higher timeframe consolidation / contraction period, as discussed in our Indicator Spotlight on the Opening Range Breakout Strategy.
Finally, managing open profits may be done by using the Wilders Volatility Stop. Other trailing stop indicators are available from the Trailing Stops category.
The indicator is available for NinjaTrader 8.