Bullish Harami
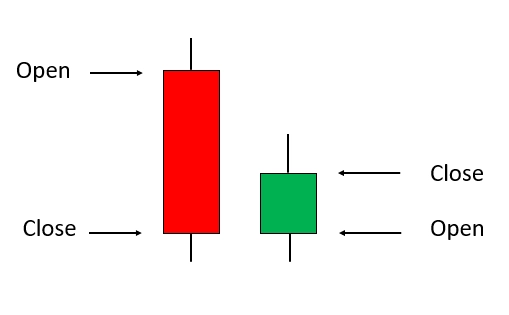
A Bullish Harami is two bar candlestick pattern indicating that a down trend may be coming to an end. It is bullish reversal pattern that may point to a shift in market sentiment. To learn more, check out the video below: What is the Bullish Harami The first bar in the Bullish Harami pattern is…
White Marubozu
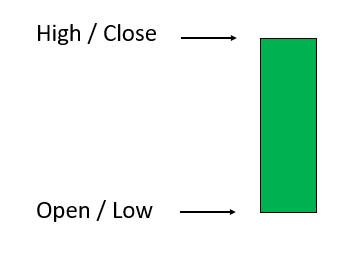
The White Marubozu pattern is very similar to the bullish belthold. The only difference is that it does not allow for a wick at the upper end of the candle. Check out the video below to learn more: What is a White Marubozu The White Marubozu opens at the lowest price of the candle, closing…
Black Marubozu
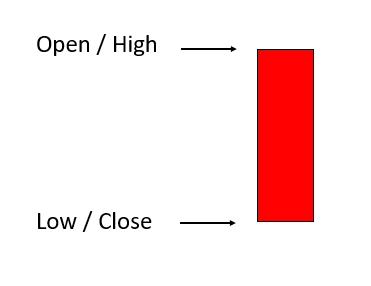
The Black Marubozu pattern is very similar to the bearish belthold. The only difference is that it does not allow for a wick at the lower end of the candle. Check out the video below to learn more: What is a Black Marubozu A Black Marubozu opens at the highest price of the candle, closing…
Hanging Man

The Hanging Man is a bearish pattern with a long lower shadow, little or no upper shadow, and a small body forming near the bar high. This may indicate that buyers have lost their strength and an impending bearish reversal. What is the Hanging Man The Hanging Man pattern indicates significant selling during an up-trend.…
Bullish Hammer
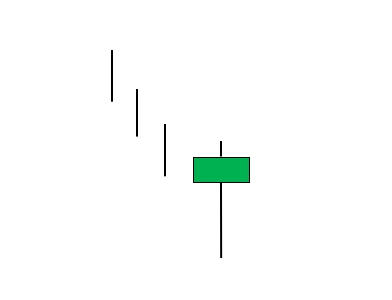
The Bullish Hammer is a price pattern which shows up when prices drop significantly, but rallies to close near the open. Visually, the pattern is a hammer-shaped candlestick with a lower shadow indicating price rejection by being significantly larger than the candle body. What is the Bullish Hammer pattern A Bullish Hammer is identified in…
Shooting Star

A Shooting Star is a one bar price action pattern that shows up when prices have advanced significantly, but then fall to close near the open. Therefore, a large upper shadow will form, significantly larger than the candle body, indicating price rejection. What is a Shooting Star A Shooting Star is a bearish pattern with…
Inverted Hammer
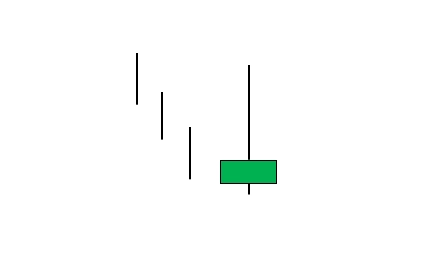
An Inverted Hammer is a bullish pattern with a long upper shadow, little or no lower shadow, and a small body forming near the bar low. This may indicate that sellers have lost their strength, supply has been pushing prices lower previously, whereas the Inverted Hammer candle indicates significant buying. What is the Inverted Hammer…
Dragonfly Doji
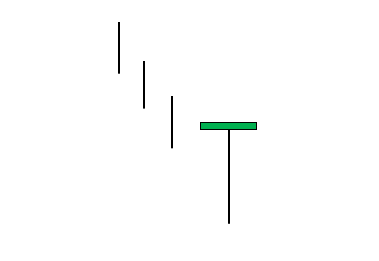
The Dragonfly Doji is a bullish pattern with a long lower shadow, little or no upper shadow and a doji forming at or near the bar high. Therefore, a Dragonfly Doji is a more restrictive version of the bullish hammer. What is a Dragonfly Doji First, the lower shadow indicates price rejection by being many…
Gravestone Doji

A Gravestone Doji is a one bar price action pattern that shows up when prices have advanced significantly, but then fall to close near the open. Therefore, a large upper shadow will form, significantly larger than the candle body, indicating price rejection. What is a Gravestone Doji A Gravestone Doji is a more restrictive version…
Dark Cloud Cover
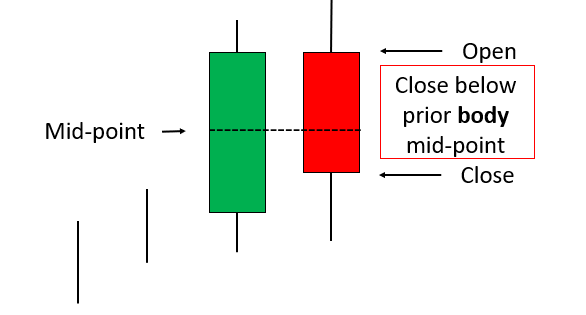
The Dark Cloud Cover is a two bar may pattern that may indicate a shift in momentum to the downside. It is composed by an up-close followed by a down-close. Accordingly, the second bearish candle is the basis for the pattern name, forming a “dark cloud” over the preceding bullish candle. What is a Dark…