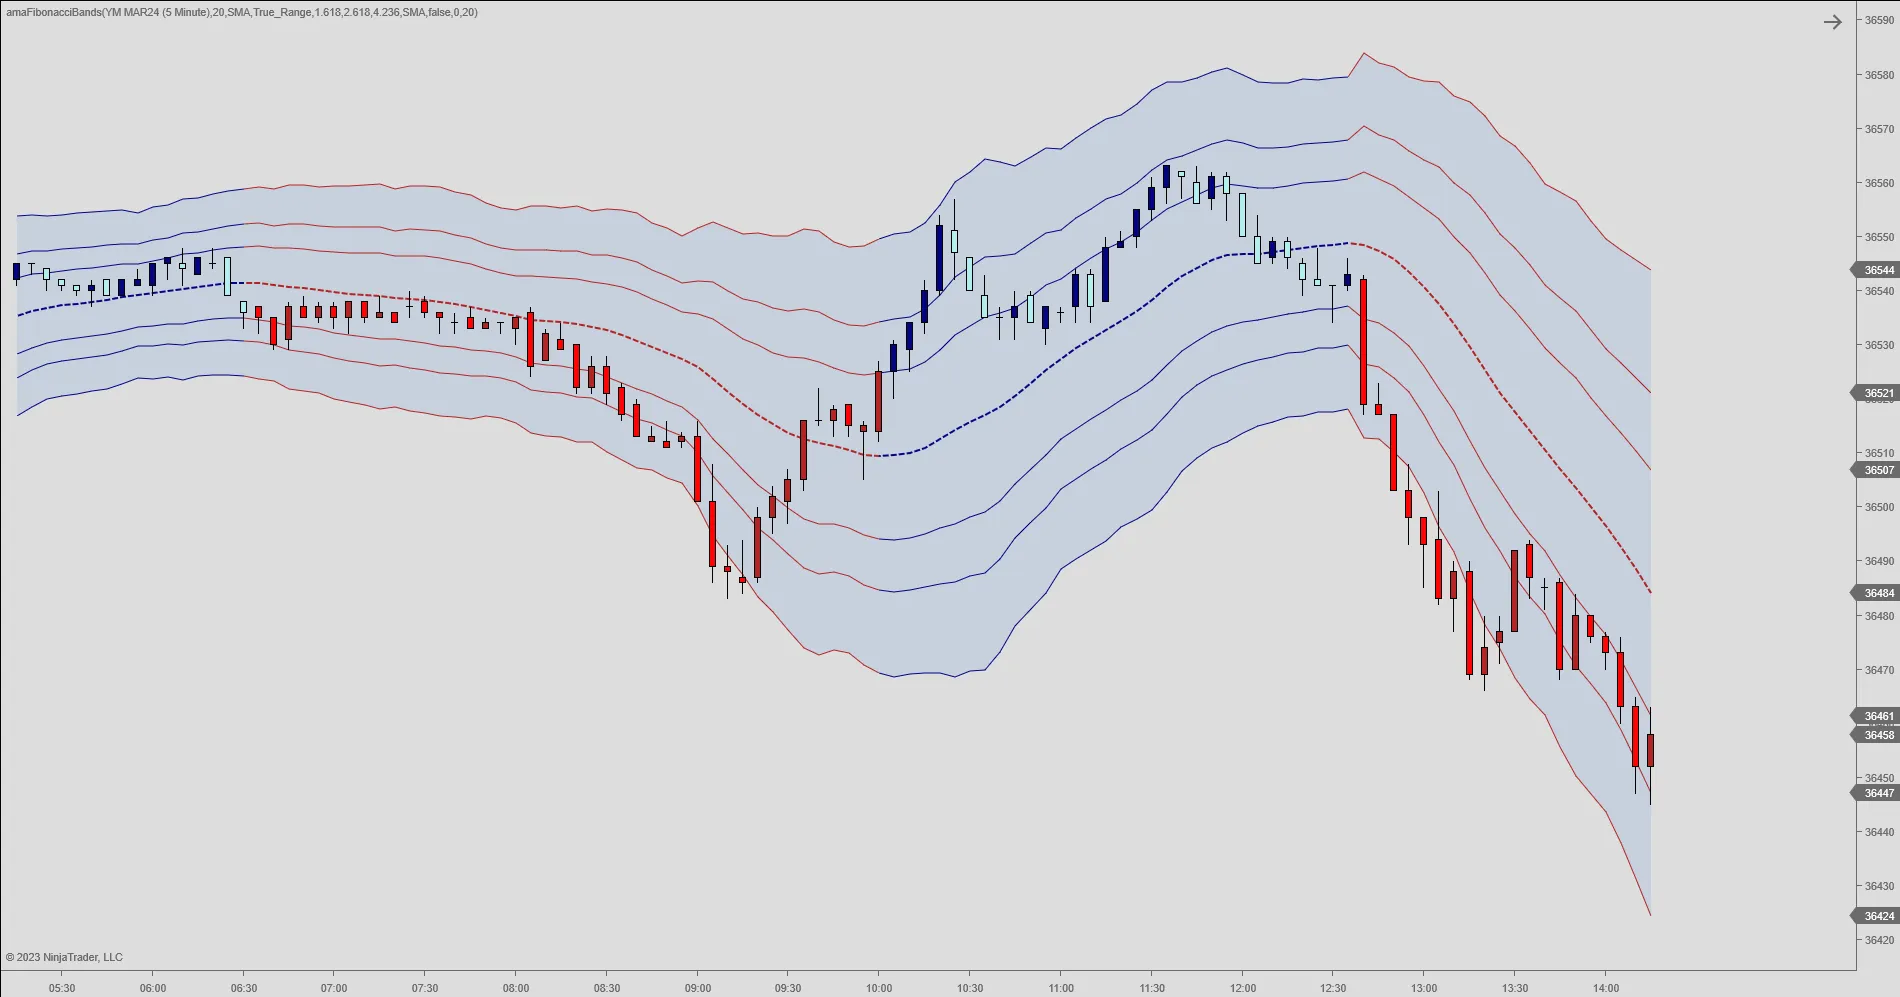
The concept of the Fibonacci Bands indicator was described by Suri Dudella in his book “Trade Chart Patterns Like the Pros” Section 8.3, page 149. The bands are derived from Fibonacci expansions from a fixed moving average and display possible areas of support and resistance.
Indicator Description
The Fibonacci Bands indicator, applies three Keltner Channels for it’s calculation. The default Fibonacci expansion levels are as follows: 1.618, 2.618 and 4.236.
One may look for trend reversals by watching the price action near the extreme Fibonacci Bands (upper and lower). When prices trade outside of the bands for a few bars and return inside, we may look for reversals. By using multiple time-frames one may consider short time-frame signals aligning with a larger time-frame scenario. Generally, you’ll want to trade in the direction of the larger time-frame. You may use the short-term support / resistance levels to determine entries and exits.
You may define the trend via the slope of the midband, also available from it own Market Analyzer column.
Fibonacci levels refer to areas of support or resistance levels calculated by using the Fibonacci sequence. A central concept here is the Golden Ratio, referring to 1.618 and it’s inverse .618. The Italian mathematician, Leonardo Fibonacci (1170-1250), is credited for bringing the sequence to the West. Fibonacci noticed that certain ratios could be calculated, and that these correspond to “divine ratios” found throughout nature, architecture and art.
Other Library Indicators
Our Indicator Library for NinjaTrader 8 has a separate category with Fibonacci indicators, including the Current Day Fibonacci Levels / Prior Day Fibonacci Levels, Current Week Fibonacci Levels / Prior Week Fibonacci Levels, the Current Month Fibonacci Levels / Prior Month Fibonacci Levels and the Current N Month Fibonacci Levels / Prior N Month Fibonacci Levels. Our Indicator Spotlight also discussed Fibonacci Retracement Levels specifically.
Other library indicators that utilize deviation bands for determining trading setups include the Bollinger Bands, Projection Bands, Standard Deviation and the Residual Deviation Bands. The Current Day Median and the Daily, Weekly, Monthly and N Monthly VWAPs also use deviation bands. The Weekly VWAP was furthermore discussed in our Indicator Spotlight, as was the Deviation Stop, which may be used for managing open profits (see our Trailing Stop Loss Indicators category).
The Indicator Spotlight has also reviewed other indicators from our Channel Indicators category, namely the Regression Channel and the Donchian Channel. The post on the Squeeze indicator is also relevant, being the dizygotic twin of the Squeeze Channel indicator. Finally, an Indicator Spotlight discussed determining trend bias using the Trigger Lines.
The Fibonacci Bands indicator is available for NinjaTrader 8.