The N-Monthly Pivots are calculated from the high, low and close of the chosen N-Month session. Our Indicator Library also features Hourly Pivot levels, Daily Pivot Levels, Weekly Pivot levels, and Monthly Pivot levels. Apart from the N-Monthly Pivot version found here in the Library section, you may also review the features of the Premium Pivot Suite and register for FREE trial anytime.
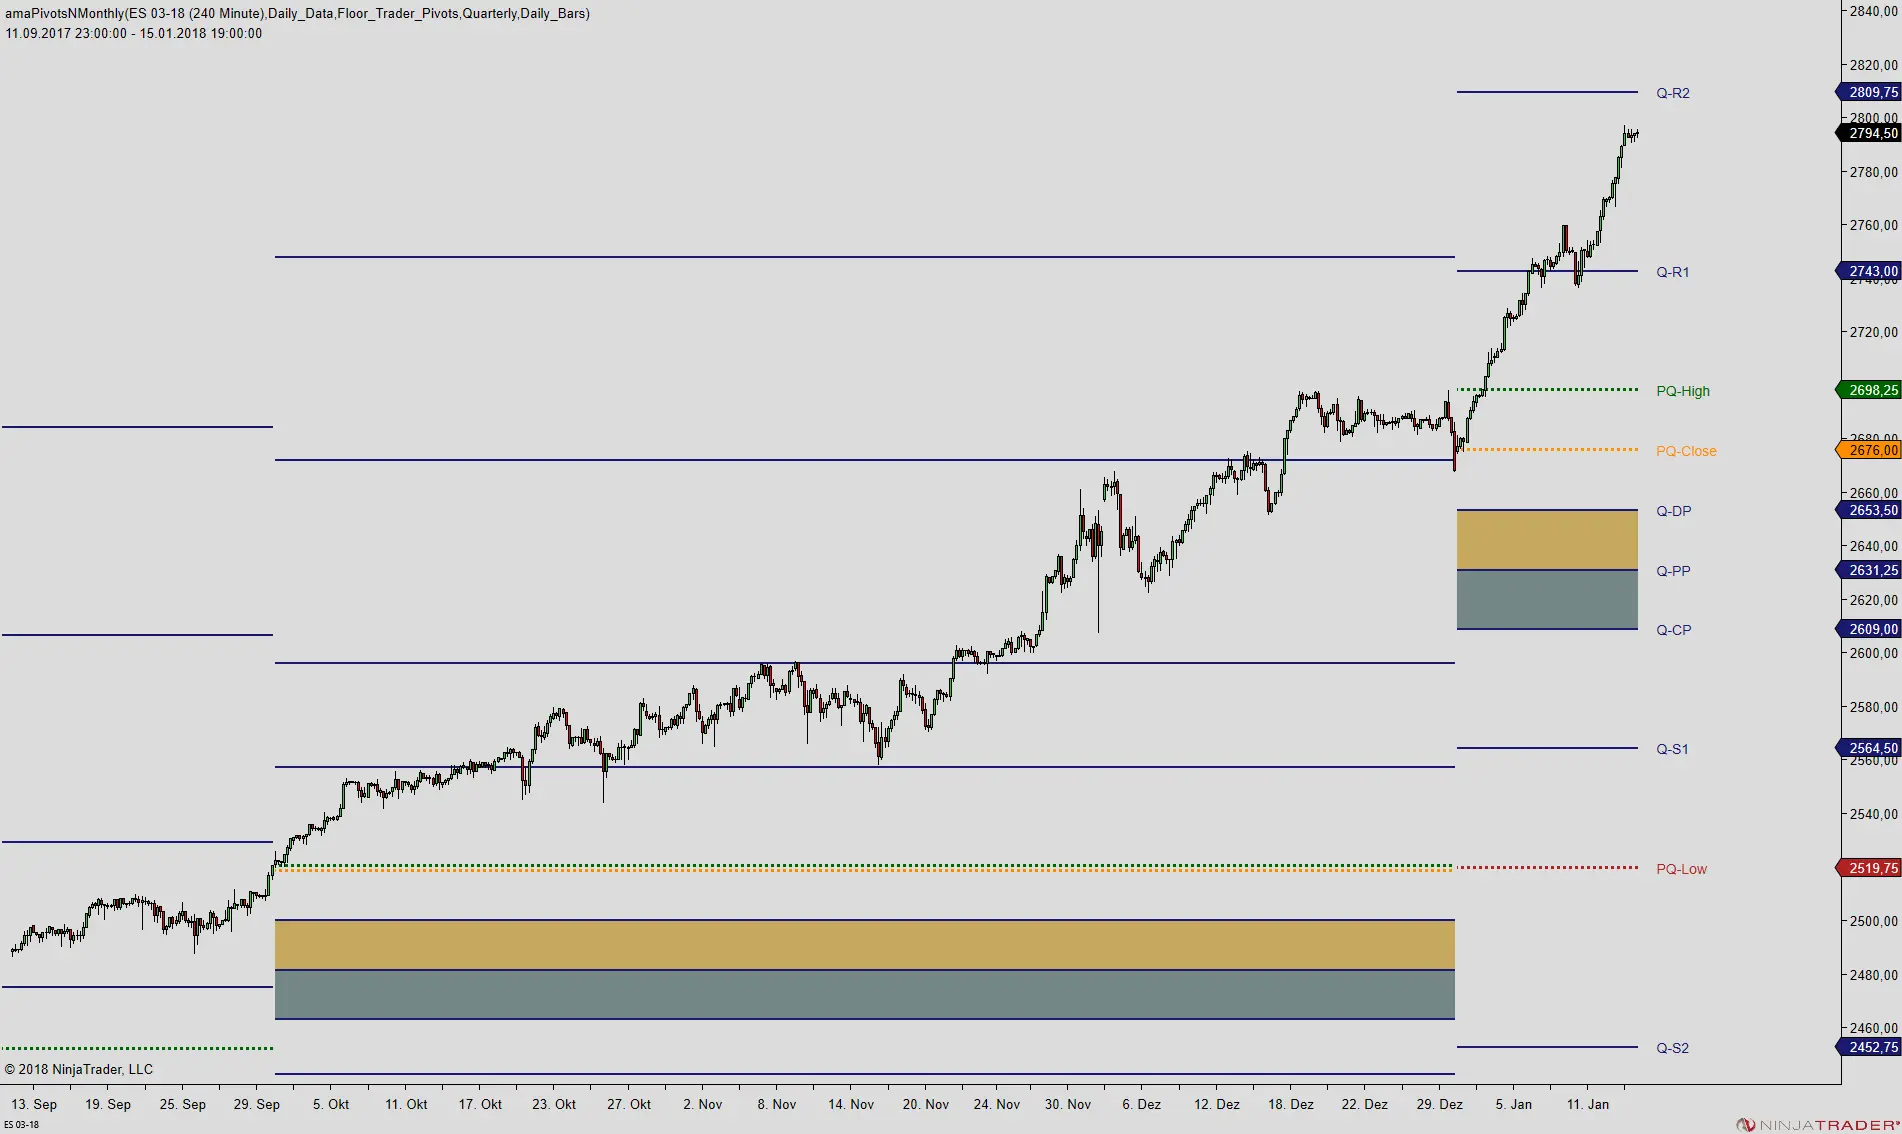
Indicator Description
You may use this indicator to establish Bi-monthly Pivots, Quarterly Pivots, Semi Annual Pivots and Yearly Pivots. The required data for the calculation is available prior to the start of the current N-Month session and does not change throughout its course. Using Pivot levels are based on a well known trading technique, originally used by local pit traders. The N-Monthly Pivots indicator can be used to create:
- Bi-monthly Pivot levels
- Quarterly Pivot levels
- Semi Annual Pivot levels
- Yearly Pivot levels
The technique has been around for decades, and because of its simplicity and efficiency, it is still in use today. The N-Monthly Pivots display GLOBEX (ETH) pivots, calculated from the high, low and close of the past month’s full session. The calculation can be used to create current bi-monthly, quarterly, bi-annual and yearly pivot levels. If you want to display floor pivots (high, low and close of the past N-month’s regular session), please refer to the premium Session Pivots package. A comparison of the library vs. premium features is available here.
You should only use the indicator with trading times consistent that reflects the contractual settings of the instruments. Also the indicator includes the option to use the settlement price in place of the regular close.
The N-Monthly Pivot indicator displays the pivot range which includes the main pivot, central pivot and directional pivot. Four (4) major support and resistance levels are located above and below the pivot range. The indicator also comes with an option to display mid-levels pivots. Furthermore, you may choose between four (4) different formulas, namely Floor Pivots, Wide Pivots, Jackson Zones and Fibonacci Pivots.
Other Library indicators
Our Indicator Spotlight previously looked at Mark Fisher’s use of the daily Pivot Range (with video) in relation to Opening Range Breakouts. Other Pivot indicators available from the Session Tools category include the Daily Camarilla Pivots, Weekly Camarilla Pivots, Monthly Camarilla Pivots and the N-Monthly Camarilla Pivots. The library also contains Daily Rolling Pivots, Weekly Rolling Pivots and Monthly Rolling Pivots. The LizardTrader blog also has information on the use of rolling pivots for trend detection.
Furthermore, you may consider average daily range levels for support / resistance. Our Indicator Spotlight previously discussed the Daily Range Projections. Weekly Range Projections and Monthly Range Projections are also available from our Volatility Indicators category.
The indicator is available for NinjaTrader 8 and is compatible with our LizardRenko bars.